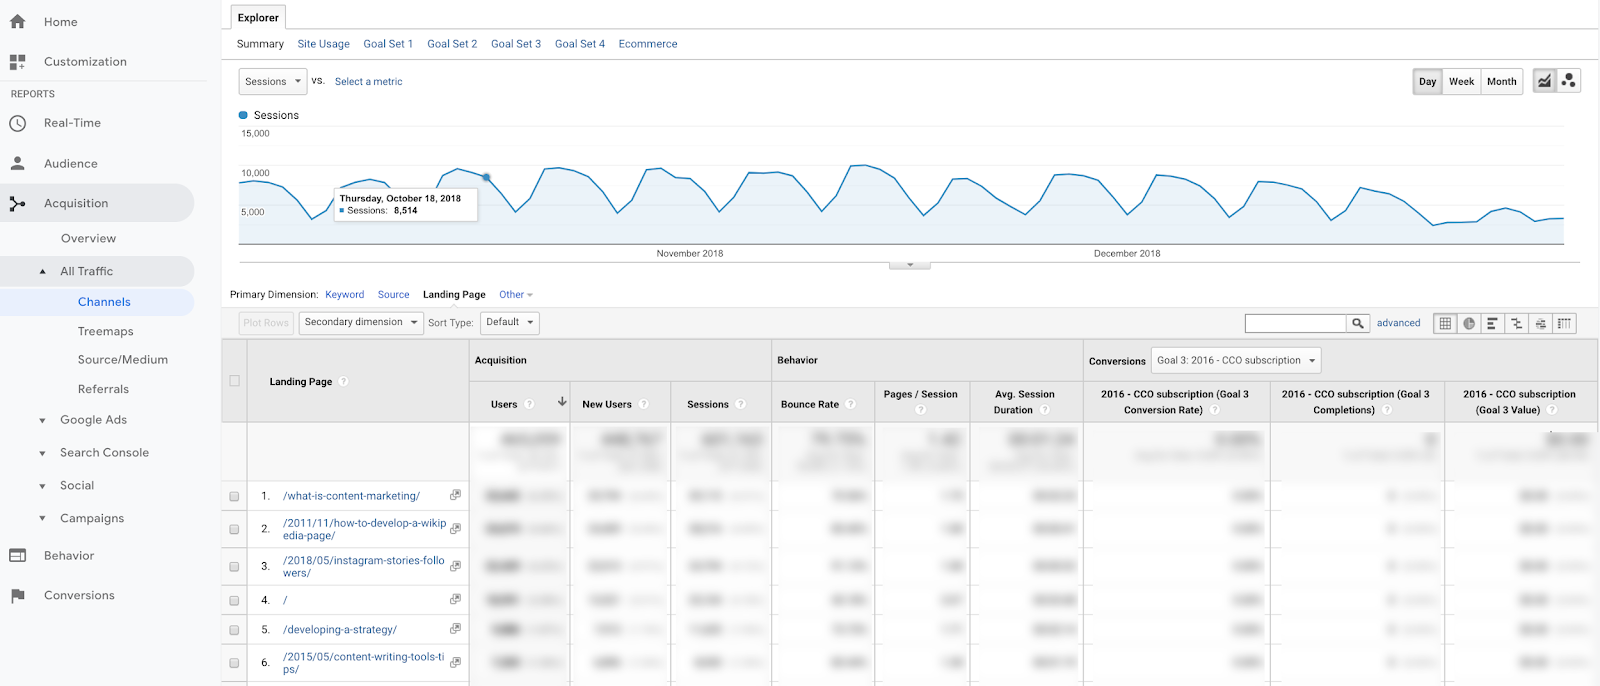
Original text


Powered by Google TranslateTranslate
The Practical Google Analytics Guide for Small Businesses
by Mark Quadros
>
May 5, 2022
Rating
person looking at analytics dashboard and metrics

Google Analytics is indispensable for business. It’s estimated that the big data and business analytics market will reach $105.08 billion, and it shows no sign of decreasing in growth. However, Google Analytics is software with quite a steep learning curve, and it can be challenging for small business owners to get the most out of it.

Keep reading to discover the most practical functions that this tool offers so you can get essential information and create greater strategies.

What’s Google Analytics and What You Can Do with it?

Google Analytics is a software built by Google to measure your website’s performance. This tool gathers data from your website, Google, and your visitors. It then visualizes it through graphs so you can easily see how your business performs.

With Google Analytics, you can: 

  • Create actionable strategies from information that otherwise wouldn’t be available for you.
  • Measure your marketing campaign’s performance, including your ROI.
  • Learn more about your target audience and the kind of content that gets better reactions.
  • See how your visitors interact with your website, find flaws, and optimize your website for the best results.

Google Analytics Sections and How to Use It

screenshot of Google Analytics dashboardSOURCE

Once you’ve set up a Google Analytics account, the first thing you’ll see is the overview.

But the real features are in the tabs on the left side of the interface.

Audience

Google Analytics side menu

The audience section shows you everything related to your visitors such as page views, the number of sessions (visits) per month, users (unique visitors), session duration, your bounce rate, among other useful numbers.

You can segment your audience further in the tabs below:

  • Location. Where your audience is located, useful if you run a local business or if you’re running a campaign targeting a specific area.
  • Demographics. The gender and the age of your average user. 
  • Interests. Affinities, preferences, and the markets where they’re more active.
  • Device and technology. Shows the devices and platforms that have been used to interact with your website, useful if you’re running an app and want to support as many browsers as possible.
  • Benchmarks. Compares your website performance with the average in your market.

Acquisition

screenshot of Google Analytics Acquisition menu

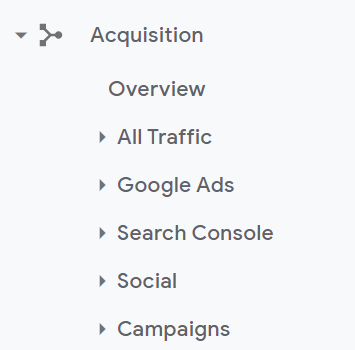
The acquisition section covers everything related to where your traffic comes from.

You’ll see how long users spend on your site, how many pages they visit, and how many users are new, depending on the channel they come from. You can decide if you need to invest more time and money in one particular channel, depending on its performance.

The tabs will give you more insights on:

  • All Traffic. Shows the total traffic and their source — the specific website the traffic comes from (Facebook, Google, backlinks) — and the medium, which is the category that sources fall within (Organic, direct traffic, referral, social). You can check if you’re getting better organic results and if it’s worth investing in paid ads.
  • Google Ads. Shows all your Google Ads campaigns and the traffic you’re getting from them. 
  • Search Console. Links with your Google Search Console account to analyze how your site performs in the SERP, tracking CTR and the keywords you’re ranking for.
  • Social. Measure the performance of your social media campaigns, and let you know which social channels are most effective.
  • Campaign reports. Allows you to add specific campaigns that you’re running on email or other platforms, and track their performance.

Behavior

screenshot of Google Analytics behavior menu

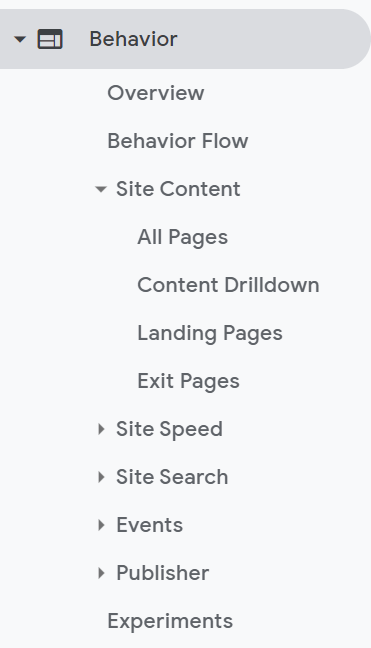
If you want to see how your visitors are navigating your website, the behavior section is the right place to do customer analytics. It helps you optimize your pages to reduce bounce rate, improve conversions, and make it easier for your users to navigate your site.

Here’s what the tabs inside do:

  • Site Content. Shows how each of your pages performs, allowing you to spot where your visitors are landing and where they’re leaving.
  • Site Speed. Allows you to test how long it takes to load your site, showing you if your site needs improvements.
  • Internal Site Search. Tells you how your visitors are using internal search and which terms they’re using, so you can better optimize your product discovery and even aim for better SEO keywords.
  • Behavior flow. Shows a graph of your visitor’s journey on your website, where they went, what did they do, and how long they stayed.

Conversions

screenshot og Google Analytics conversion menu

The goals feature is key to set up your marketing KPIs and measure your business success. You’ll only find it in the conversion section. Besides setting and tracking goals, it also has specialized features for e-commerce businesses and online marketing funnels.

Here’s how they work:

  • Goals. You can define a specific action as a goal (such as a download, registration, or sale), and let Google Analytics measure it and visualize it. You can use it along with a lead generation tool, like a quiz, to track your leads, set monetary value to your leads, and calculate the ROI of your campaigns.
  • E-commerce tracking. Allows you to measure how your products perform, track more data from your customers, and calculate customer’s lifetime value if you’re running an e-commerce business.
  • Multi-channel funnel. You can define your whole sales funnel, and measure how each step is performing. Great for spotting pages that are not converting enough and thus dragging your sales down.

Key Google Analytics Metrics

Google Analytics is nothing without the metrics. So here are the most essential metrics you’ll be watching regularly:

  • Pageviews, sessions, and new visitors
  • Traffic sources
  • Bounce rate
  • Pages visited per session
  • Cost of conversion
  • Average time on page
  • Goals and revenue

Get Started with Google Analytics

We’re living in an era where not leveraging big data is a competitive disadvantage. As a small business, you need to onboard the big data train as soon as possible if you want to grow bigger. Google Analytics is one of the most used tools for this so get started and make the right decisions.

SHARE THIS ARTICLE
About the author
mark-quadros-headshot
Mark Quadros
Mark Quadros is a SaaS content marketer that helps brands create and distribute rad content.
Read full bio
CONNECT
712 H St NE PMB 98848
}
Washington, DC 20002
1-800-634-0245

Copyright © 2024 SCORE Association, SCORE.org

Funded, in part, through a Cooperative Agreement with the U.S. Small Business Administration. All opinions, and/or recommendations expressed herein are those of the author(s) and do not necessarily reflect the views of the SBA.

Chat generously provided by:LiveChat

In partnership with
Jump back to top